
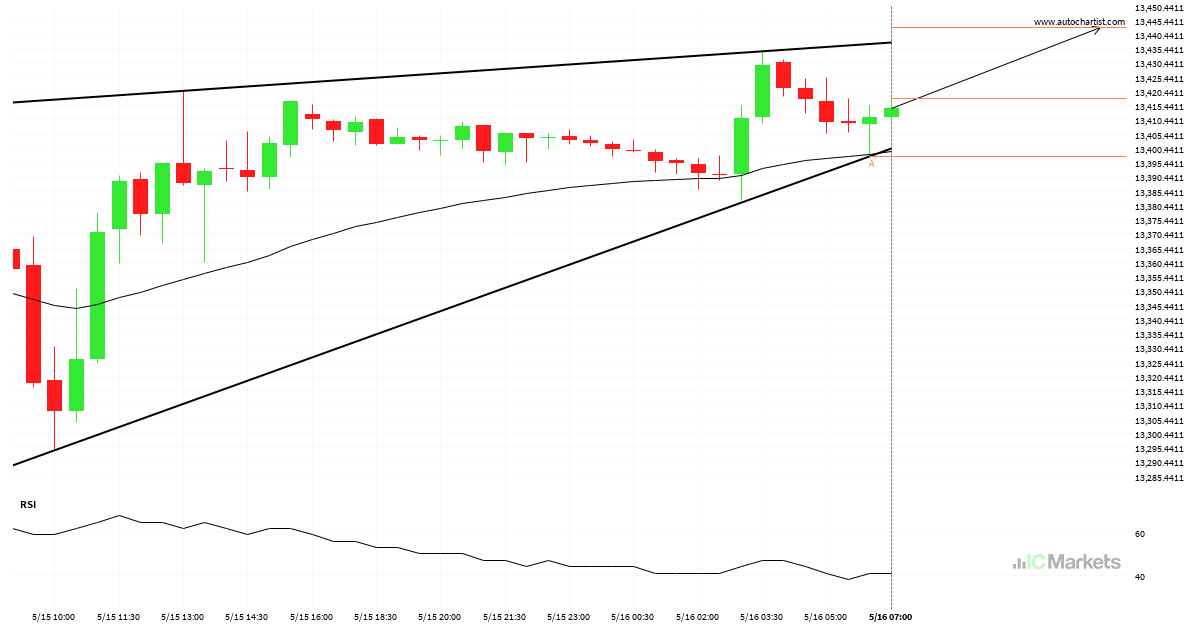
US Tech 100 Index approaching resistance of a Cunha ascendente
US Tech 100 Index is approaching the resistance line of a Cunha ascendente. It has touched this line numerous times in the last 2 days. If it tests this line again, it should do so in the next 6 hours.
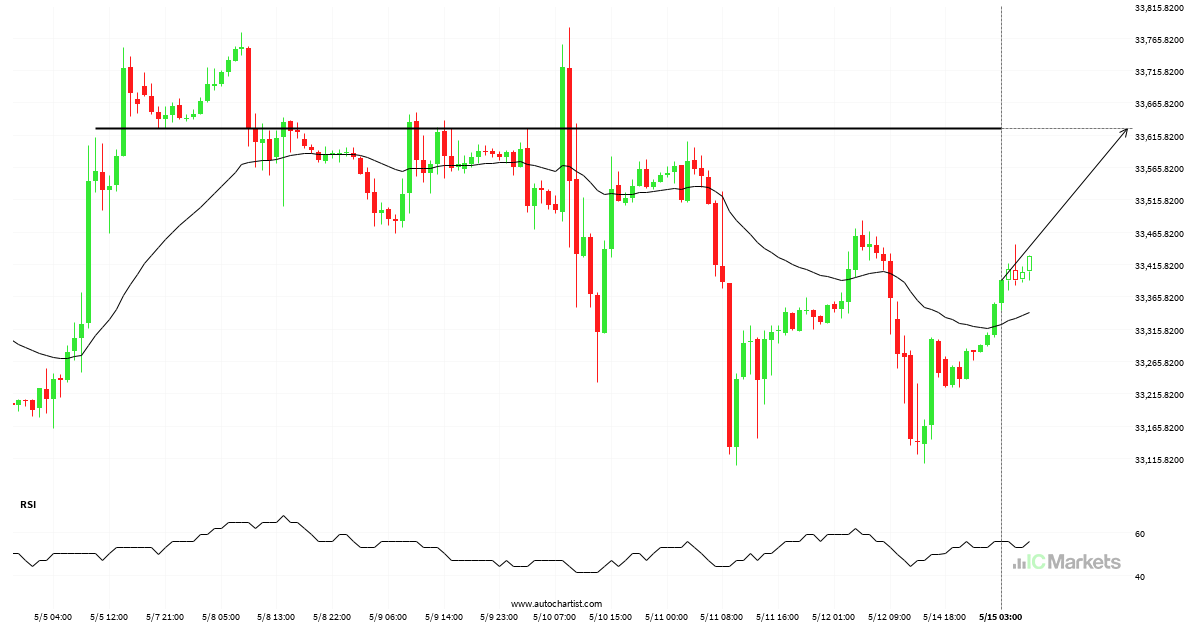
US Wall Street 30 Index – getting close to psychological price line
US Wall Street 30 Index is moving towards a resistance line. Because we have seen it retrace from this level in the past, we could see either a break through this line, or a rebound back to current levels. It has touched this line numerous times in the last 10 days and may test it […]
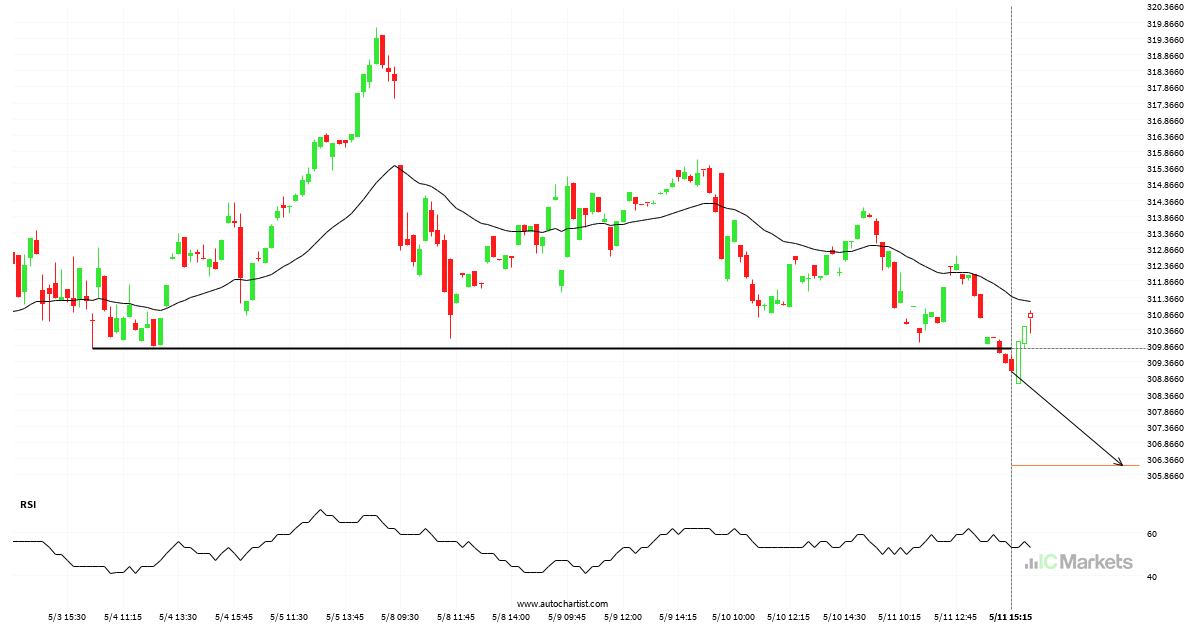
Biogen Idec Inc broke through important 309.7700 price line
Biogen Idec Inc has broken through a support line. It has touched this line numerous times in the last 8 days. This breakout shows a potential move to 306.1700 within the next 8 hours. Because we have seen it retrace from this level in the past, one should wait for confirmation of the breakout.
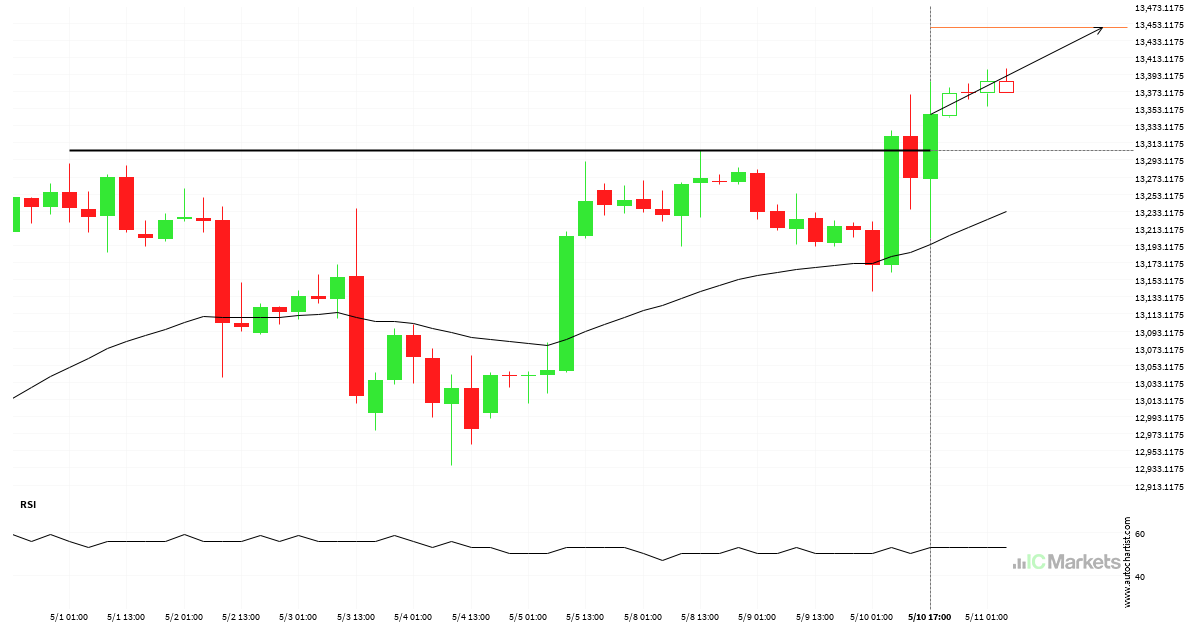
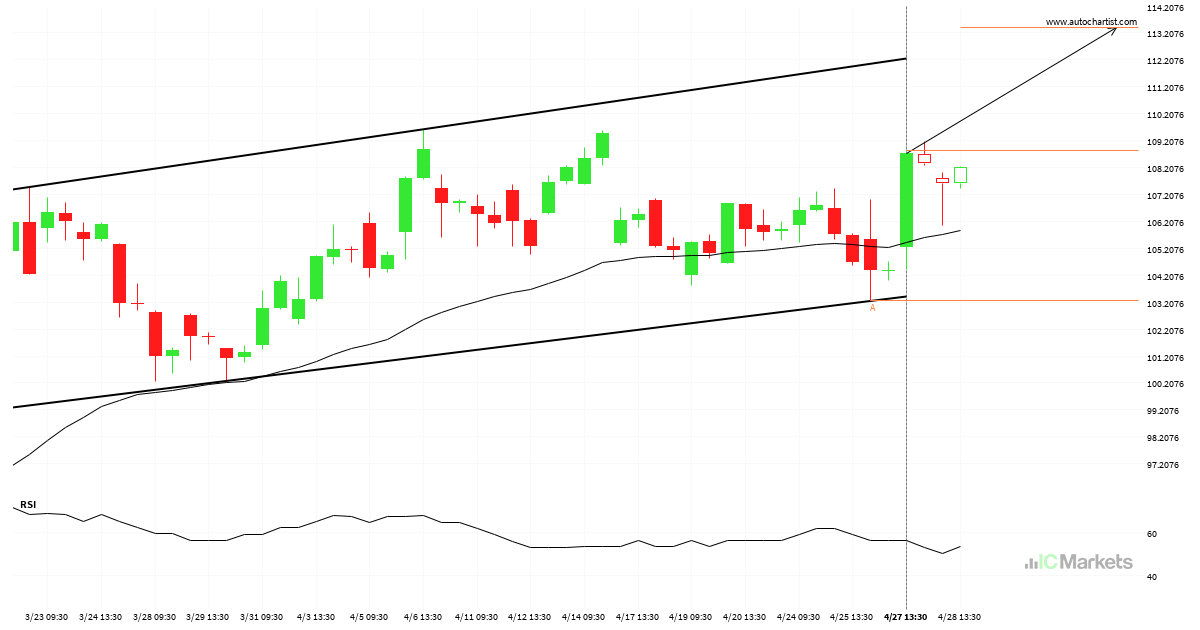
US Tech 100 Index broke through important 13304.5996 price line
US Tech 100 Index has broken through a resistance line. It has touched this line numerous times in the last 10 days. This breakout shows a potential move to 13447.5596 within the next 2 days. Because we have seen it retrace from this level in the past, one should wait for confirmation of the breakout.
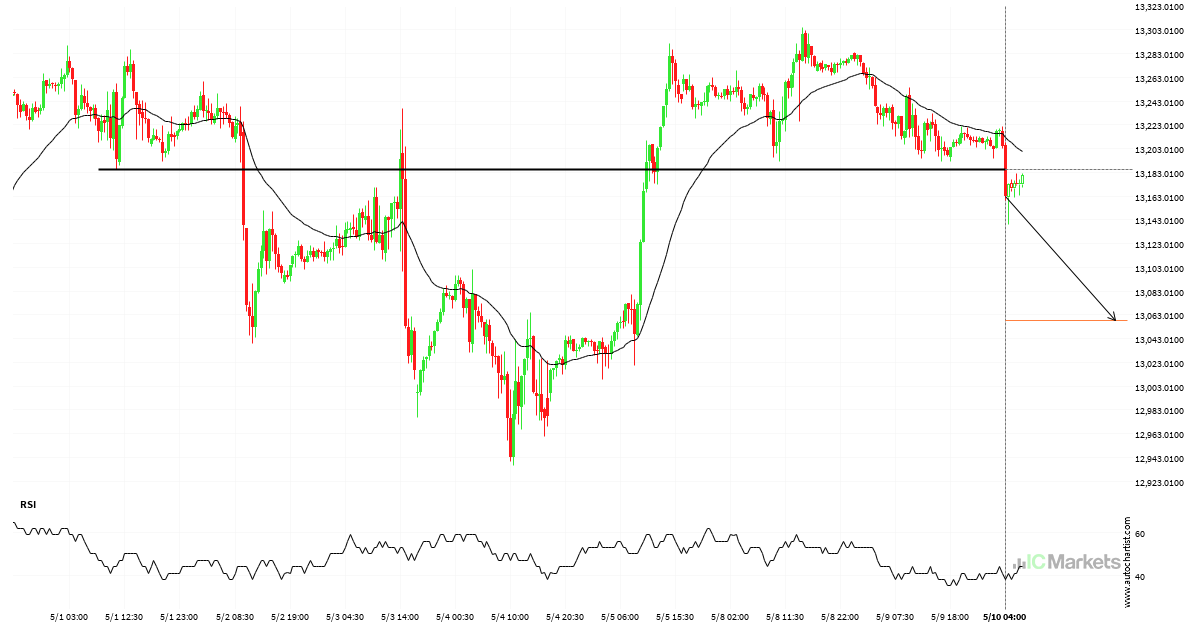
US Tech 100 Index broke through important 13185.2998 price line
US Tech 100 Index has broken through a support line. It has touched this line numerous times in the last 9 days. This breakout shows a potential move to 13058.2998 within the next 2 days. Because we have seen it retrace from this level in the past, one should wait for confirmation of the breakout.
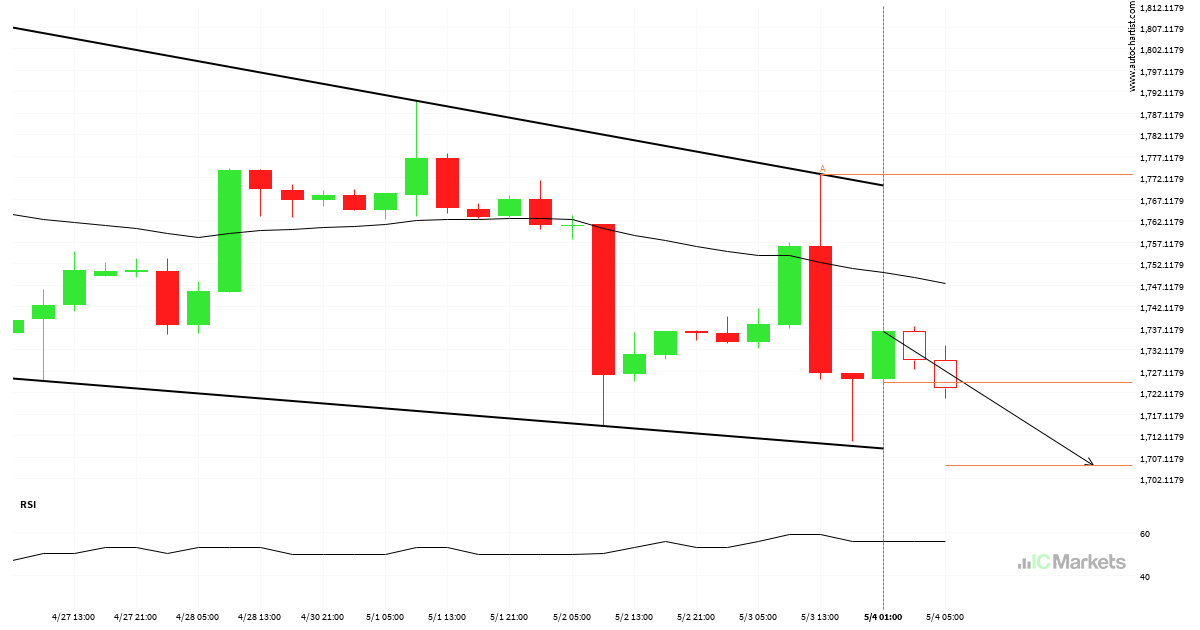
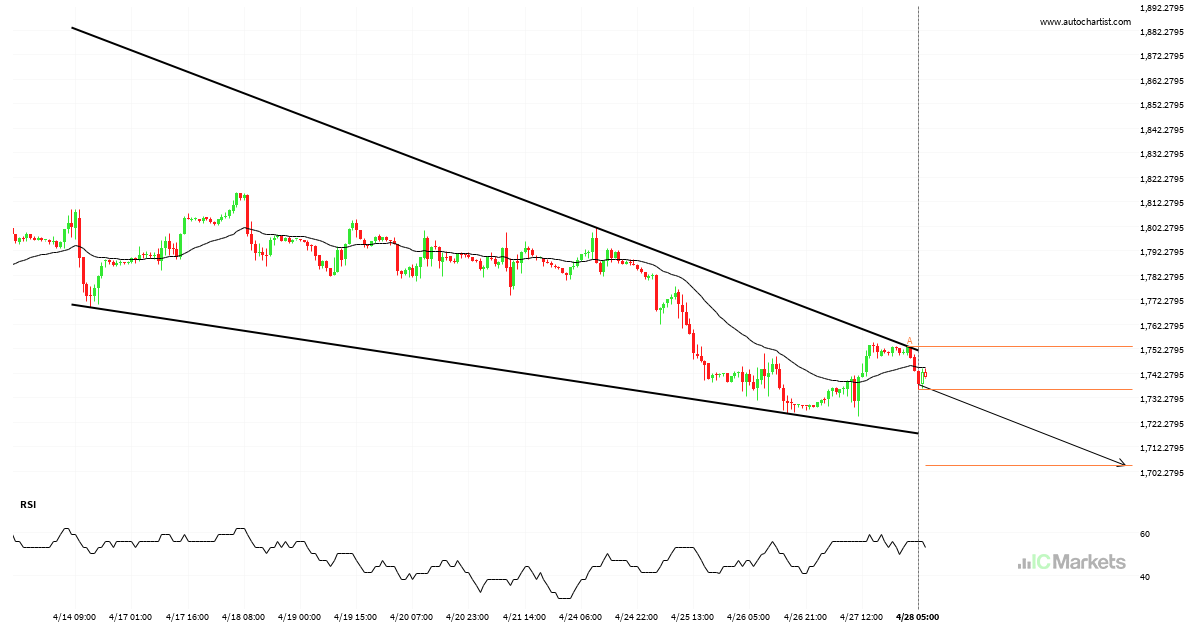
US Small Cap 2000 Index approaching support of a Cunha descendente
US Small Cap 2000 Index is approaching the support line of a Cunha descendente. It has touched this line numerous times in the last 10 days. If it tests this line again, it should do so in the next 2 days.
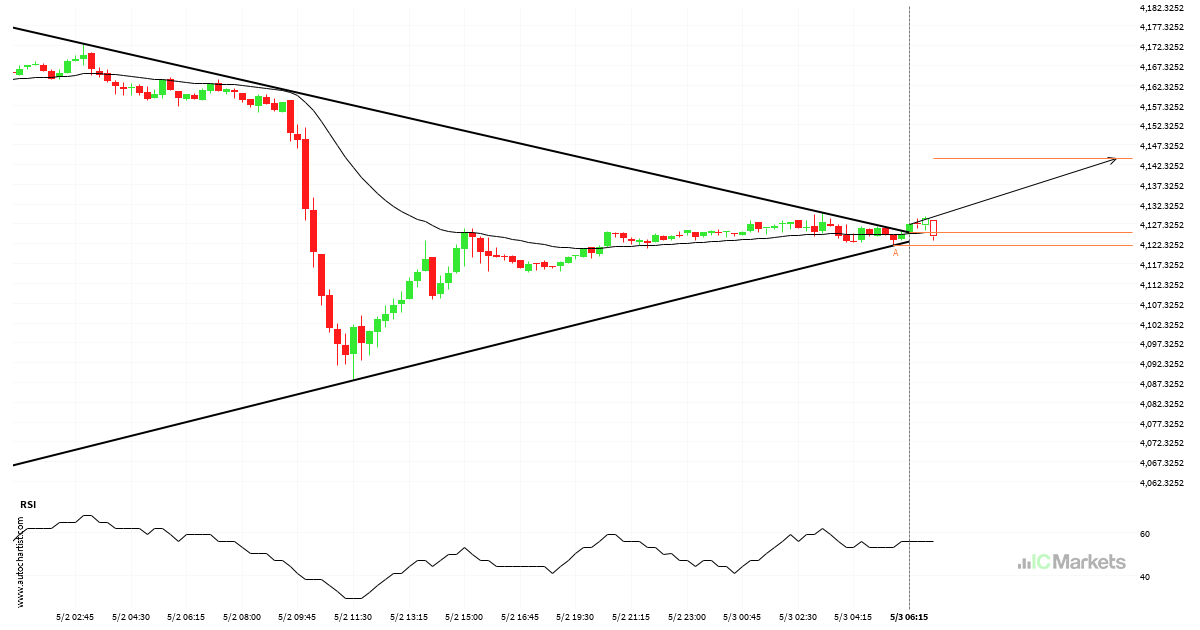
US SPX 500 Index has broken through resistance
US SPX 500 Index has broken through a resistance line. It has touched this line at least twice in the last 2 days. This breakout may indicate a potential move to 4143.9370 within the next 8 hours. Because we have seen it retrace from this position in the past, one should wait for confirmation of […]
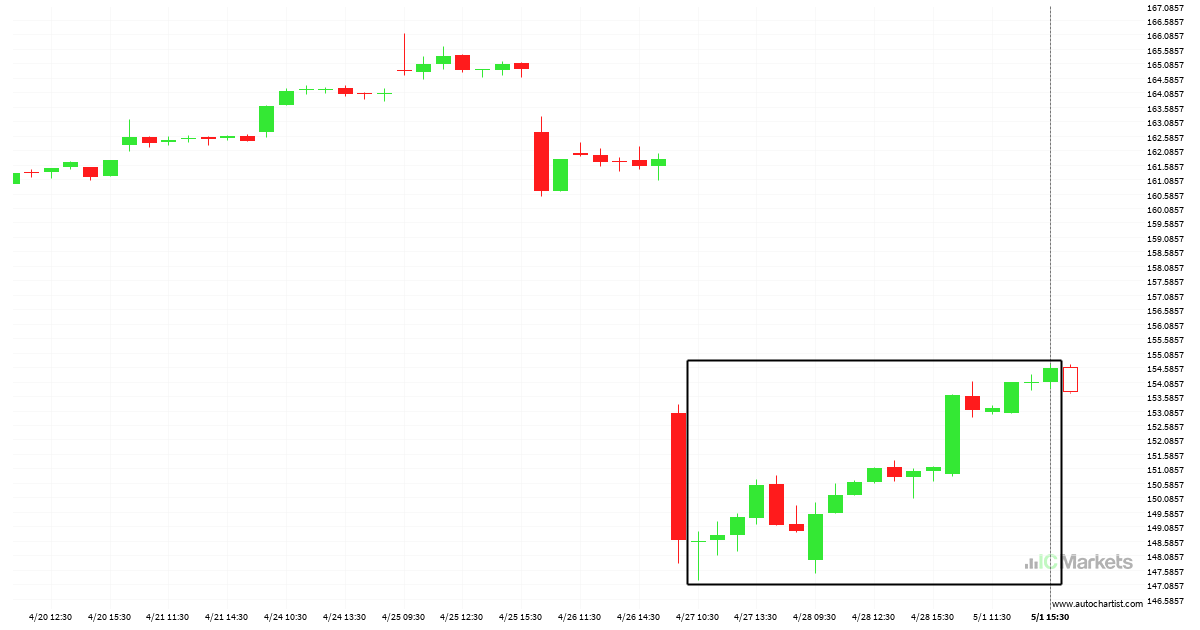
Huge bullish move on AbbVie
AbbVie has moved higher by 4,02% from 148.59 to 154.56 in the last 5 days.
ALPHABET INC CLASS C approaching resistance of a Canal ascendente
ALPHABET INC CLASS C is approaching the resistance line of a Canal ascendente. It has touched this line numerous times in the last 46 days. If it tests this line again, it should do so in the next 2 days.
US Small Cap 2000 Index approaching support of a Cunha descendente
US Small Cap 2000 Index is approaching the support line of a Cunha descendente. It has touched this line numerous times in the last 14 days. If it tests this line again, it should do so in the next 3 days.